AUTOMATICALLY GENERATED NARRATIVES
Time of creation: Wed Aug 25 14:19:00 EDT 2021
MAJOR CLUSTERS
The network is divided into 17 co-citation clusters. The largest 6 clusters are summarized as follows.
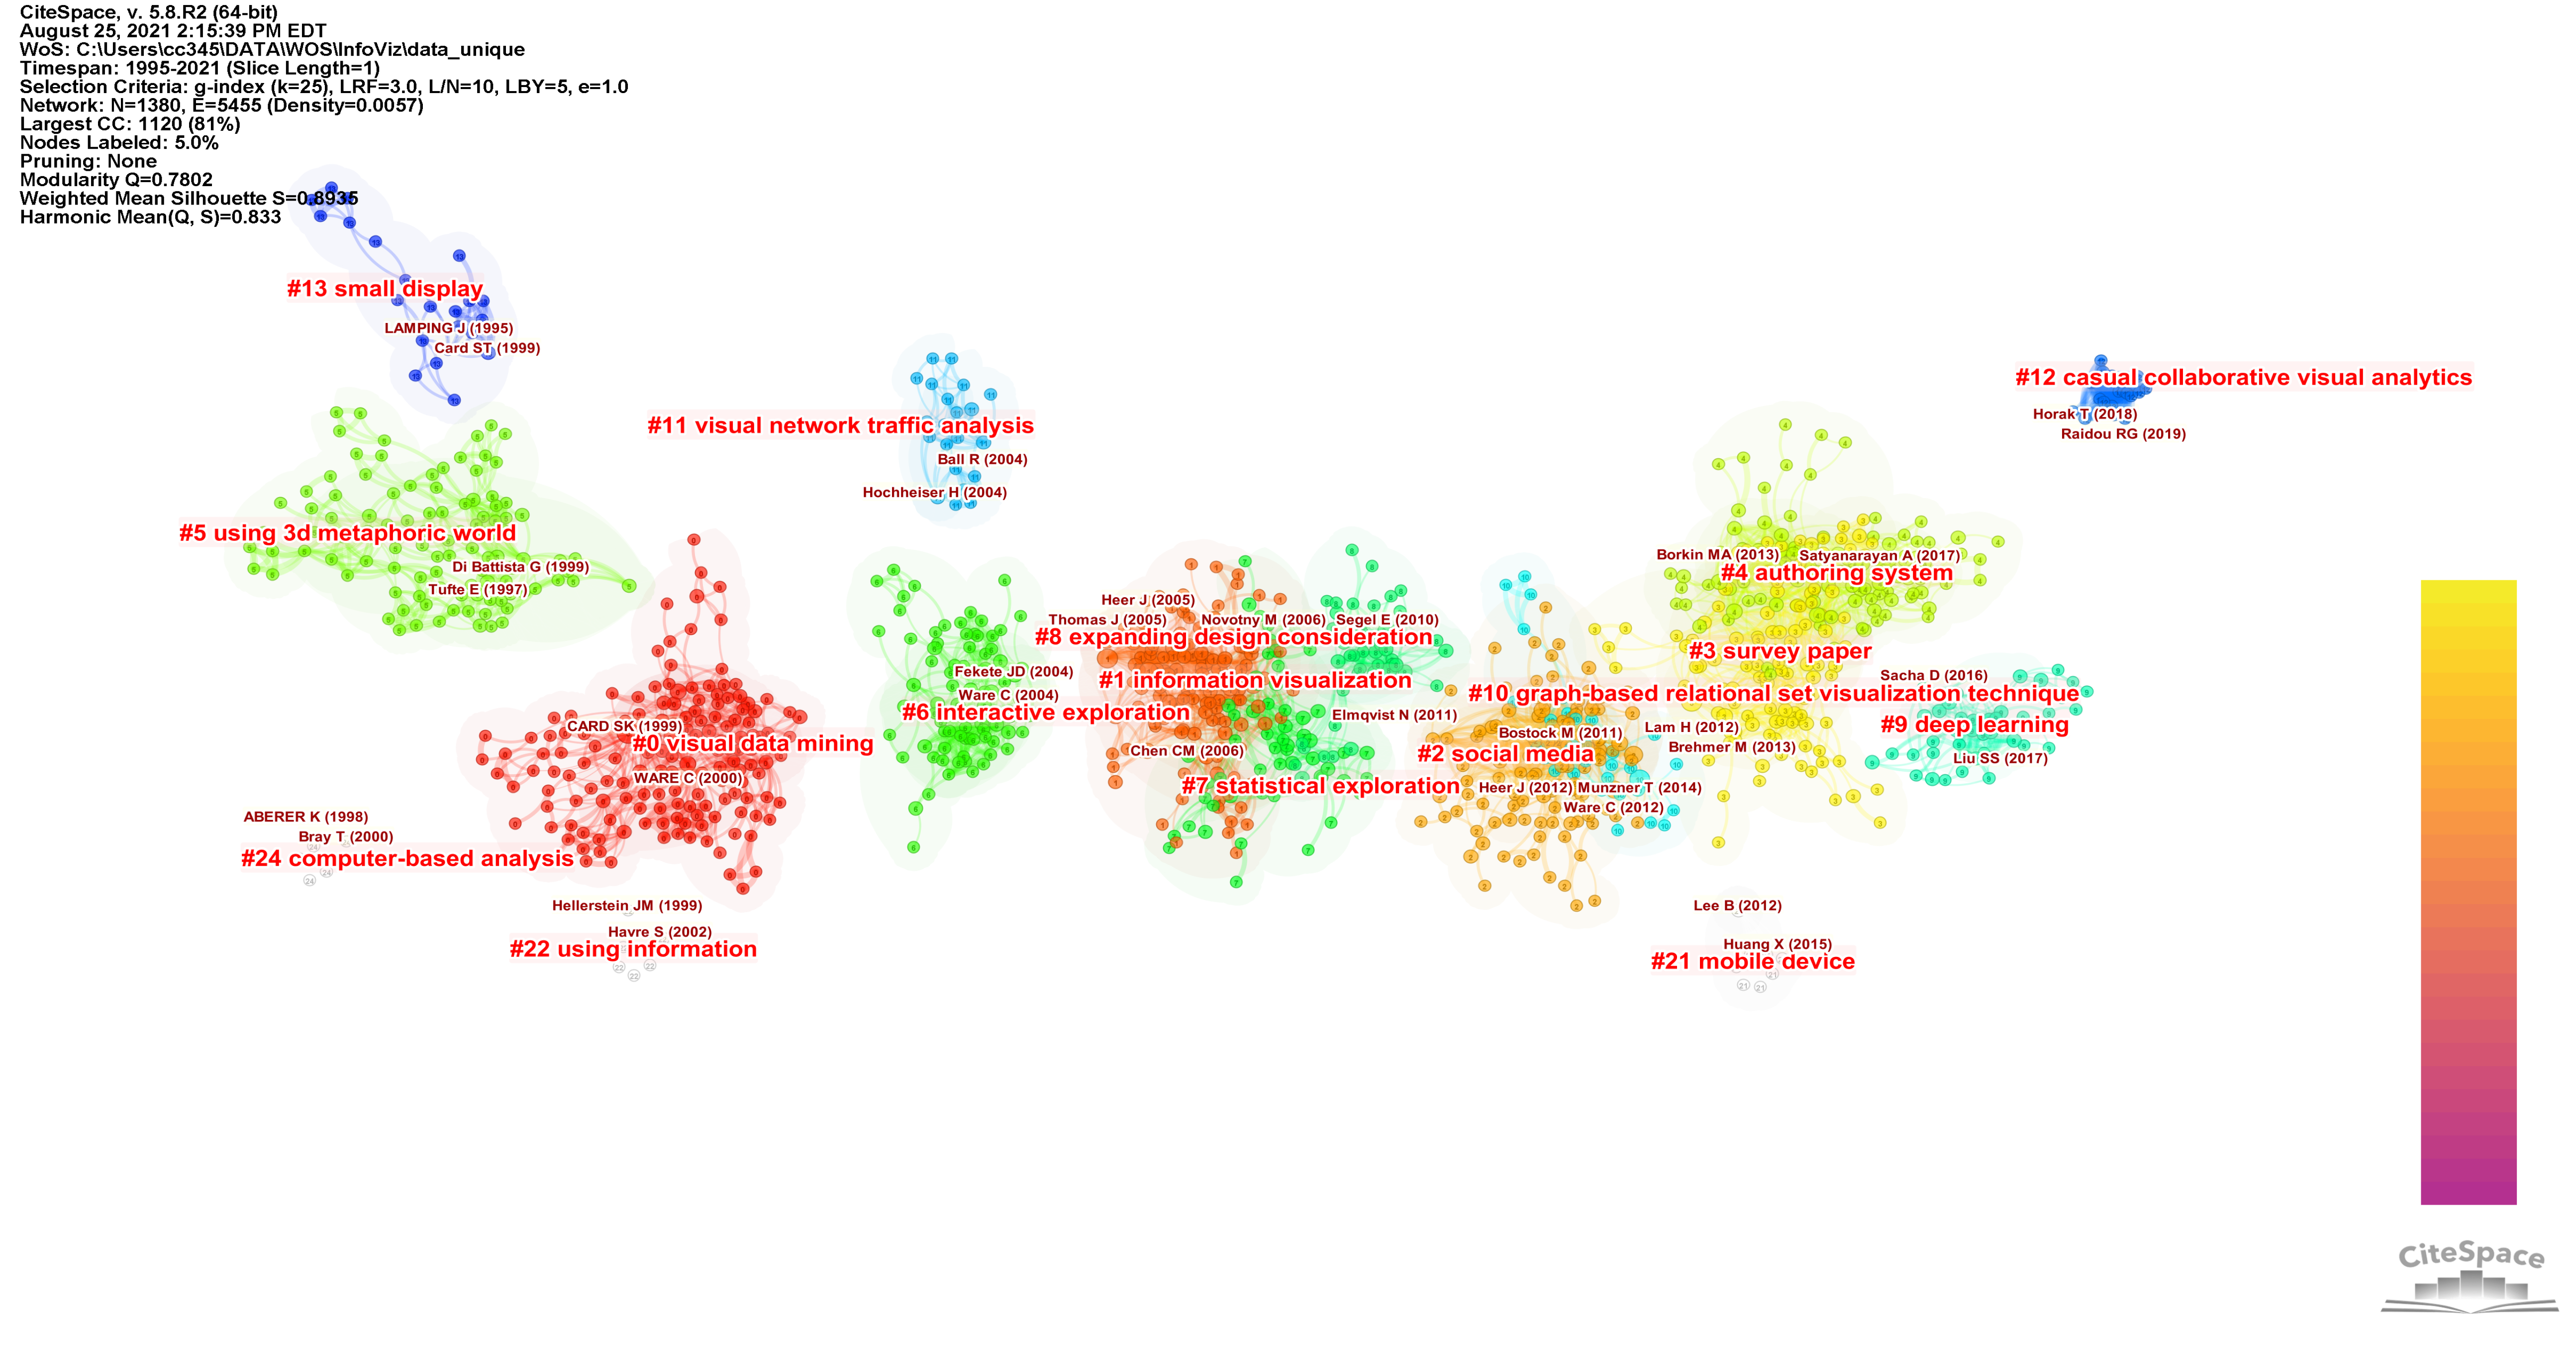
Figure. An overview of the network.
Table 1. Summary of the largest 6 clusters.
| ClusterID |
Size |
Silhouette |
Label (LSI) |
Label (LLR) |
Label (MI) |
Average Year |
| 0 |
157 |
0.899 |
visual data mining |
visual data mining (957.65, 1.0E-4) |
exploring high-d space (0.74) |
2000 |
| 1 |
144 |
0.893 |
information visualization |
information visualization (373.84, 1.0E-4) |
structured approach (1.9) |
2006 |
| 2 |
129 |
0.82 |
information visualization |
social media (673.6, 1.0E-4) |
visualizing abstract information (1.95) |
2011 |
| 3 |
121 |
0.798 |
information visualization |
survey paper (242.2, 1.0E-4) |
visualizing abstract information (0.98) |
2014 |
| 4 |
107 |
0.858 |
information visualization |
authoring system (379.96, 1.0E-4) |
visualizing abstract information (0.79) |
2015 |
| 5 |
105 |
0.954 |
information visualization |
using 3d metaphoric world (304.41, 1.0E-4) |
citation mapping (0.07) |
1996 |
The largest cluster (#0) has 157 members and a silhouette value of 0.899. It is labeled as visual data mining by both LLR and LSI, and as exploring high-d space (0.74) by MI. The most relevant citer to the cluster is Zhu, B (2005.0) Information visualization. ANNUAL REVIEW OF INFORMATION SCIENCE AND TECHNOLOGY, V39, P39 DOI 10.1002/aris.1440390111.
The second largest cluster (#1) has 144 members and a silhouette value of 0.893. It is labeled as information visualization by both LLR and LSI, and as structured approach (1.9) by MI. The most relevant citer to the cluster is Lungu, Mircea (2007.0) Biomedical information visualization. HUMAN-CENTERED VISUALIZATION ENVIRONMENTS Lecture Notes in Computer Science, V4417, P52.
The third largest cluster (#2) has 129 members and a silhouette value of 0.82. It is labeled as social media by LLR, information visualization by LSI, and visualizing abstract information (1.95) by MI. The most relevant citer to the cluster is Liu, Shixia (2014.0) A survey on information visualization: recent advances and challenges. VISUAL COMPUTER, V30, P21 DOI 10.1007/s00371-013-0892-3.
The 4th largest cluster (#3) has 121 members and a silhouette value of 0.798. It is labeled as survey paper by LLR, information visualization by LSI, and visualizing abstract information (0.98) by MI. The most relevant citer to the cluster is Behrisch, M (2018.0) Quality metrics for information visualization. COMPUTER GRAPHICS FORUM, V37, P38 DOI 10.1111/cgf.13446.
The 5th largest cluster (#4) has 107 members and a silhouette value of 0.858. It is labeled as authoring system by LLR, information visualization by LSI, and visualizing abstract information (0.79) by MI. The most relevant citer to the cluster is Ens, Barrett (2021.0) Uplift: a tangible and immersive tabletop system for casual collaborative visual analytics. IEEE TRANSACTIONS ON VISUALIZATION AND COMPUTER GRAPHICS, V27, P11 DOI 10.1109/TVCG.2020.3030334.
The 6th largest cluster (#5) has 105 members and a silhouette value of 0.954. It is labeled as using 3d metaphoric world by LLR, information visualization by LSI, and citation mapping (0.07) by MI. The most relevant citer to the cluster is Herman, I (2000.0) Graph visualization and navigation in information visualization: a survey. IEEE TRANSACTIONS ON VISUALIZATION AND COMPUTER GRAPHICS DOI 10.1109/2945.841119.
CITATION COUNTS
The top ranked item by citation counts is Bostock M (2011) in Cluster #2, with citation counts of 71. The second one is CARD SK (1999) in Cluster #0, with citation counts of 70. The third is Thomas J (2005) in Cluster #1, with citation counts of 59. The 4th is Lam H (2012) in Cluster #3, with citation counts of 51. The 5th is Munzner T (2014) in Cluster #10, with citation counts of 50. The 6th is Ware C (2012) in Cluster #2, with citation counts of 47. The 7th is Liu SX (2014) in Cluster #2, with citation counts of 44. The 8th is Heer J (2005) in Cluster #1, with citation counts of 39. The 9th is Ware C (2004) in Cluster #6, with citation counts of 36. The 10th is Viegas FB (2007) in Cluster #1, with citation counts of 34.
| Citation Counts | References | DOI | Cluster ID |
|---|
| 71 | Bostock M, 2011, IEEE T VIS COMPUT GR, 17, 2301 | 10.1109/TVCG.2011.185 | 2 |
| 70 | CARD SK, 1999, READINGS INFORMATION, 0, 0 | | 0 |
| 59 | Thomas J, 2005, ILLUMINATING PATH RE, 0, 0 | | 1 |
| 51 | Lam H, 2012, IEEE T VIS COMPUT GR, 18, 1520 | 10.1109/TVCG.2011.279 | 3 |
| 50 | Munzner T, 2014, VISUALIZATION ANAL D, 0, 0 | | 10 |
| 47 | Ware C, 2012, INFORM VISUALIZATION, 0, 0 | | 2 |
| 44 | Liu SX, 2014, VISUAL COMPUT, 30, 1373 | 10.1007/s00371-013-0892-3 | 2 |
| 39 | Heer J, 2005, P SIGCHI C HUM FACT, 0, 421 | 10.1145/1054972.1055031] | 1 |
| 36 | Ware C, 2004, INFORM VISUALIZATION, 0, 0 | | 6 |
| 34 | Viegas FB, 2007, IEEE T VIS COMPUT GR, 13, 1121 | 10.1109/TVCG.2007.70577 | 1 |
BURSTS
The top ranked item by bursts is CARD SK (1999) in Cluster #0, with bursts of 40.43. The second one is Bostock M (2011) in Cluster #2, with bursts of 31.77. The third is Thomas J (2005) in Cluster #1, with bursts of 27.86. The 4th is Munzner T (2014) in Cluster #10, with bursts of 21.35. The 5th is Lam H (2012) in Cluster #3, with bursts of 20.06. The 6th is Ware C (2004) in Cluster #6, with bursts of 18.56. The 7th is Ware C (2012) in Cluster #2, with bursts of 18.46. The 8th is Heer J (2005) in Cluster #1, with bursts of 18.33. The 9th is WARE C (2000) in Cluster #0, with bursts of 17.53. The 10th is Liu SX (2014) in Cluster #2, with bursts of 16.66.
| Bursts | References | DOI | Cluster ID |
|---|
| 40.43 | CARD SK, 1999, READINGS INFORMATION, 0, 0 | | 0 |
| 31.77 | Bostock M, 2011, IEEE T VIS COMPUT GR, 17, 2301 | 10.1109/TVCG.2011.185 | 2 |
| 27.86 | Thomas J, 2005, ILLUMINATING PATH RE, 0, 0 | | 1 |
| 21.35 | Munzner T, 2014, VISUALIZATION ANAL D, 0, 0 | | 10 |
| 20.06 | Lam H, 2012, IEEE T VIS COMPUT GR, 18, 1520 | 10.1109/TVCG.2011.279 | 3 |
| 18.56 | Ware C, 2004, INFORM VISUALIZATION, 0, 0 | | 6 |
| 18.46 | Ware C, 2012, INFORM VISUALIZATION, 0, 0 | | 2 |
| 18.33 | Heer J, 2005, P SIGCHI C HUM FACT, 0, 421 | 10.1145/1054972.1055031] | 1 |
| 17.53 | WARE C, 2000, INFORMATION VISUALIZ, 0, 0 | | 0 |
| 16.66 | Liu SX, 2014, VISUAL COMPUT, 30, 1373 | 10.1007/s00371-013-0892-3 | 2 |
CENTRALITY
The top ranked item by centrality is CARD SK (1999) in Cluster #0, with centrality of 67. The second one is Thomas J (2005) in Cluster #1, with centrality of 51. The third is Byron L (2008) in Cluster #1, with centrality of 46. The 4th is Correa CD (2012) in Cluster #2, with centrality of 45. The 5th is WARE C (2000) in Cluster #0, with centrality of 44. The 6th is Ersoy O (2011) in Cluster #2, with centrality of 40. The 7th is Cao N (2011) in Cluster #2, with centrality of 37. The 8th is Grammel L (2010) in Cluster #8, with centrality of 36. The 9th is Bertini E (2011) in Cluster #2, with centrality of 35. The 10th is Borkin MA (2016) in Cluster #4, with centrality of 34.
| Centrality | References | DOI | Cluster ID |
|---|
| 67 | CARD SK, 1999, READINGS INFORMATION, 0, 0 | | 0 |
| 51 | Thomas J, 2005, ILLUMINATING PATH RE, 0, 0 | | 1 |
| 46 | Byron L, 2008, IEEE T VIS COMPUT GR, 14, 1245 | 10.1109/TVCG.2008.166 | 1 |
| 45 | Correa CD, 2012, IEEE T VIS COMPUT GR, 18, 106 | 10.1109/TVCG.2010.260 | 2 |
| 44 | WARE C, 2000, INFORMATION VISUALIZ, 0, 0 | | 0 |
| 40 | Ersoy O, 2011, IEEE T VIS COMPUT GR, 17, 2364 | 10.1109/TVCG.2011.233 | 2 |
| 37 | Cao N, 2011, IEEE T VIS COMPUT GR, 17, 2581 | 10.1109/TVCG.2011.188 | 2 |
| 36 | Grammel L, 2010, IEEE T VIS COMPUT GR, 16, 943 | 10.1109/TVCG.2010.164 | 8 |
| 35 | Bertini E, 2011, IEEE T VIS COMPUT GR, 17, 2203 | 10.1109/TVCG.2011.229 | 2 |
| 34 | Borkin MA, 2016, IEEE T VIS COMPUT GR, 22, 519 | 10.1109/TVCG.2015.2467732 | 4 |
SIGMA
The top ranked item by sigma is Thomas J (2005) in Cluster #1, with sigma of 0.19. The second one is Byron L (2008) in Cluster #1, with sigma of 0.17. The third is Segel E (2010) in Cluster #8, with sigma of 0.14. The 4th is Tufte E R (2001) in Cluster #0, with sigma of 0.13. The 5th is Yee KP (2001) in Cluster #5, with sigma of 0.13. The 6th is Di Battista G (1999) in Cluster #5, with sigma of 0.12. The 7th is CARD SK (1999) in Cluster #0, with sigma of 0.11. The 8th is Carpendale S (2008) in Cluster #1, with sigma of 0.11. The 9th is Ware C (2004) in Cluster #6, with sigma of 0.09. The 10th is Wongsuphasawat K (2016) in Cluster #4, with sigma of 0.08.
| Sigma | References | DOI | Cluster ID |
|---|
| 0.19 | Thomas J, 2005, ILLUMINATING PATH RE, 0, 0 | | 1 |
| 0.17 | Byron L, 2008, IEEE T VIS COMPUT GR, 14, 1245 | 10.1109/TVCG.2008.166 | 1 |
| 0.14 | Segel E, 2010, IEEE T VIS COMPUT GR, 16, 1139 | 10.1109/TVCG.2010.179 | 8 |
| 0.13 | Tufte E R, 2001, VISUAL DISPLAY QUANT, 3rd, 0 | | 0 |
| 0.13 | Yee KP, 2001, IEEE SYMPOSIUM ON INFORMATION VISUALIZATION 2001, 0, 43 | | 5 |
| 0.12 | Di Battista G, 1999, GRAPH DRAWING ALGORI, 0, 0 | | 5 |
| 0.11 | CARD SK, 1999, READINGS INFORMATION, 0, 0 | | 0 |
| 0.11 | Carpendale S, 2008, LECT NOTES COMPUT SC, 4950, 19 | 10.1007/978-3-540-70956-5_2 | 1 |
| 0.09 | Ware C, 2004, INFORM VISUALIZATION, 0, 0 | | 6 |
| 0.08 | Wongsuphasawat K, 2016, IEEE T VIS COMPUT GR, 22, 649 | 10.1109/TVCG.2015.2467191 | 4 |