Mapping the Universe: Space, Time, and Discoveries
Chaomei Chen, Jian Zhang, Michael S. Vogeley, J. Richard Gott III, Mario Juric, Lisa Kershner

Background photo courtesy of Stephen Kent: the SDSS image of the week June 12, 2007 – the Coma cluster.
|
What is this map about? This map consists of three components: 1) a circular depiction of the entire visible universe 2) a time spiral of emergent themes in astronomical literature specifically related to the Sloan Digital Sky Survey (SDSS) 3) a structural network of statistically identified unique inter-topic relations over time The universe is shown in a polar coordinate system: each astronomical object is placed according to its right ascension (angle around the sky) and the logarithm of its distance from Earth. The 1 million astronomical objects on the map include 382,716 galaxies and quasars found by SDSS. More than 100 commonly known objects are marked by their discovery dates. In addition, discoveries of objects, including some of the most distant quasars made by high-impact SDSS publications, are marked on the map in terms of the durations of accelerated citation growth (continuous burst of citations) or the year of discovery. The time spiral of emergent themes represents novel and statistically unique themes extracted from the SDSS research literature. SDSS has led to numerous high-impact discoveries at an unprecedented rate. It is particularly challenging to predict future discoveries. On the other hand, the map projects some promising early predictive signs of future research activities. The acceleration of citation growth in the contemporary body of SDSS publications sustains 3.17 years on average with a standard deviation of 1.8 years. The newly emerged topics and connections (in the network component and the time spiral) identify the candidates of the future points of growth. This means that the impact of themes and topics shown in the current map is likely to rise continuously in the coming 2-3 years. We are integrating insights from a wide variety of sources in order to identify characteristics of potentially high-impact topics of the future based on their trajectories in the past and present as well as newly emerged topics. Acknowledgements The work is supported by the National Science Foundation under Grant No. 0612129.
References
|

|
This close-up image shows the scales used in the universe map, ranging from kilometers (km), astronomic units (AU), parsecs (pc), kiloparsecs (kpc), megaparsecs (mpc), and gigaparsecs(gpc). All distances are logarithmically scaled. Below is a conversion table to lightyears. · 1 astronomical unit = 1.58128588 × 10⁻⁵ lightyears· 1 parsec = 3.26163626 lightyears (about 3 lightyears)· 1 kiloparsec = 3,261.63626 light years (about 3,000 lightyears)· 1 megaparsec = 3,261,636.26 lightyears (about 3 million lightyears)· 1 gigaparsec = 3.26163626 × 10⁹ light years (about 3 billion lightyears) |
|
|

|
The above close-up view corresponds to the area near the Earth. It shows a variety of astronomical and man-made objects near to the Earth. One astronomical unit (AU) is the distance between the Earth and the Sun, within the 1AU radius from the Earth, the map shows the Hubble Space Telescope (HST), the Moon, the Sun, Halley’s comet (1758). Space probes Voyager 1, Voyager 2, Pioneer 10, and Ulysses are between 10 AU and 100 AU from us. Towards the upper left corner, we can find Alpha Centauri (prehistory) and Proxima Centauri(prehistory). Towards the lower right corner, we can find the Orion nebula (1610) and the Crab nebular (1731).
|
|
This close-up view corresponds to the lower left corner of the overall map. The band of red dots depicts high redshift quasars and the band of blue dots depict SDSS galaxies. Notable points of interest in this region include the Sloan Great Wall (2003), the CfA2 Great Wall (1989), 3C 273 (1963), and the Great Attractor (1986). Along the rim of the plot, which marks the scope of the visible universe, there are star-shaped markers on QSO B1145+5308(2003-2003), QSO 1044+0125 (2000-2004), and QSO J1030+0524 (2003-2004). The durations such as (2003-2004) indicate that papers about these objects tend to receive sharply increased citations during these periods of time. |

|
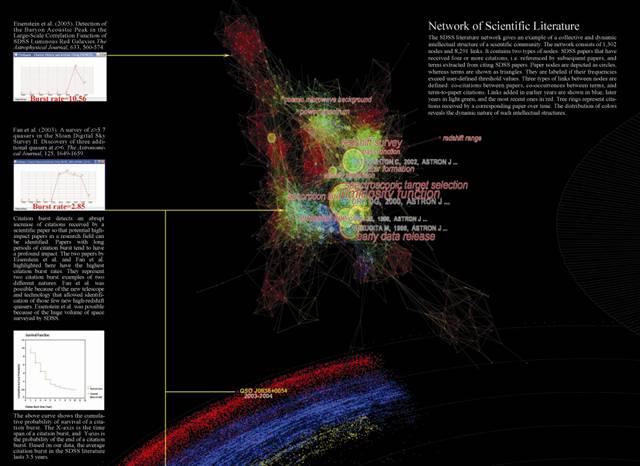
The above network shows statistically significant associations between concepts extracted from the abstracts of SDSS publications. Different shades of cyan are used to depict the freshness of topics. The brighter the color, the fresher the topic. For example, at the upper right corner, radio source is a relatively old topic, but its associations with radio flux density level and radio variability did not appear to be special until recently based on log-likelihood ratio tests. |

|
The time spiral shows the history of new topics found in the SDSS publications each year. Note that common topics are filtered from the spiral because we are interested in novel topics that have not drawn enough attention in the literature and we are interested in candidates for future growth points of high-impact discoveries. |
Download
Poster submitted to Places & Spaces on June 12, 2007:
http://cluster.cis.drexel.edu/~cchen/projects/sdss/images/poster.tif (300dpi, 346Mb)
Contact