|
Coordinated Visualization and Analysis of Sky Survey Data and Astronomical Literature National Science Foundation Grant No. 0612129 (2006-2010)
Investigators: Dr. Chaomei Chen (IST); Dr. Michael S. Vogeley (Physics) Research Assistants: James Zhang; Danny Pan For further information, contact: chaomei.chen@cis.drexel.edu
GoalsThe goal of the research is to significantly increase scientists’ abilities to overcome practical challenges that increasingly hinder scientific discoveries and knowledge creation. The project focuses on two such challenges in astronomy, namely 1) studying the vast amount of astronomical data being collected and 2) keeping abreast with the fast-moving frontiers of research. In this project, we particularly focus on the astronomical data from the Sloan Digital Sky Survey (SDSS), which is now in its second phrase, known as SDSS-II, and the SDSS literature, which is defined as the entirety of publications relevant to SDSS or based on the SDSS data. It is worth noting that the total number of cited references in the SDSS literature has doubled in the past 1.5 years from 20,000 cited references to 40,000 cited references. The danger of dealing with each of the challenges on its own is that one could be easily overwhelmed by the massive volume of data and the existing knowledge and thus lost the sight of potential but often obscured connections between what is known and what is to be discovered. The key objective of the project is to make it easier for scientists to find potential connections between the latest scientific knowledge and properties of observational data. Specifically, our plan is to coordinate and integrate the two different but interrelated sources of information so that SDSS astronomers can seamlessly access not only both types of information simultaneously but also potential associations between them.
Objectives1) establish a conceptual framework that can sustain the integration and coordination needs 2) develop algorithms and tools for tracking the frontlines of research and facilitating hypothesis generation and testing 3) develop intuitive visual environments so that we can integrate astronomical data and knowledge in a cohesive and unifying platform 4) to evaluate the effectiveness of the strategy and techniques and extend the approach to other scientific disciplines
Publications (See http://www.pages.drexel.edu/~cc345/papers/papers.html for a complete list) 1. Zhang, J., Chen, C. (2010) Collaboration in Open Data eScience: A Case Study of Sloan Digital Sky Survey. iConference 2010. University of Illinois at Urbana-Champaign. February 3-6, 2010. 2. Chen, C., Chen, Y., Horowitz, M., Hou, H., Liu, Z., & Pellegrino, D. (2009). Towards an explanatory and computational theory of scientific discovery. Journal of Informetrics, 3(3), 191-209. 3. Chen, C., Zhang, J., Vogeley, M. S. (2009) Mapping the global impact of Sloan Digital Sky Survey. IEEE Intelligent Systems, 24(4), 74-77. 4. Chen, C., Zhang, J., Vogeley, M. S. (2009). Making sense of the evolution of a scientific domain: A visual analytic study of the Sloan Digital Sky Survey research. Scientometrics. 10.1007/s11192-009-0123-x 5. Zhang, J., Chen, C., Li, J. (2009) Visualizing the intellectual structure with paper-reference matrices. IEEE InfoVis 2009. Atlantic City, New Jersey. October 11-16, 2009. IEEE Transactions on Visualization and Computer Graphics, 15(6), 1153-1160. 6. Chen, C., Zhang, J. Vogeley, M. S. (2009) Visual analysis of scientific discoveries and knowledge diffusion. Proceedings of the 12th International Conference on Scientometrics and Informetrics (ISSI 2009). Rio de Janeiro, Brazil. July 14-17, 2009. pp. 874-885. 7. Chen, C., Zhang, J., Vogeley, M. S. (2009) Reflections on the Interdisciplinary Collaborative Design of Mapping the Universe. HCI International 2009. San Diego, CA. July 19-24, 2009. pp. 693-702. 8. Zhang, J., Vogeley, M. S., Chen, C. (2008) Scientometrics of big science: A case study of research in Sloan Digital Sky Survey. Scientometrics. 9. Chen, C., Ibekwe-SanJuan, F., Pinho, R., Zhang, J. (2008) The impact of the Sloan Digital Sky Survey on Astronomical Research: The Role of Culture, Identity and International Collaboration. The 10th International Conference of the International Society for Knowledge Organization (ISKO), Montréal, Québec. August 5-8, 2008. 10. Ibekwe-SanJuan, F., Chen, C., Pinho, R. (2008) Identifying strategic information from scientific articles through sentence classification. Proceedings of the Sixth International Language Resources and Evaluation (LREC'08). Marrakech, Morocco. May 28-30, 2008. 11. Chen, C., Zhang, J., Zhu, W., Vogeley, M. (2007) Delineating the citation impact of scientific discoveries. IEEE/ACM Joint Conference on Digital Libraries (JCDL 2007). June 17-22, 2007. Vancouver, British Columbia, Canada. [PDF]
|

|
Gallery |
|
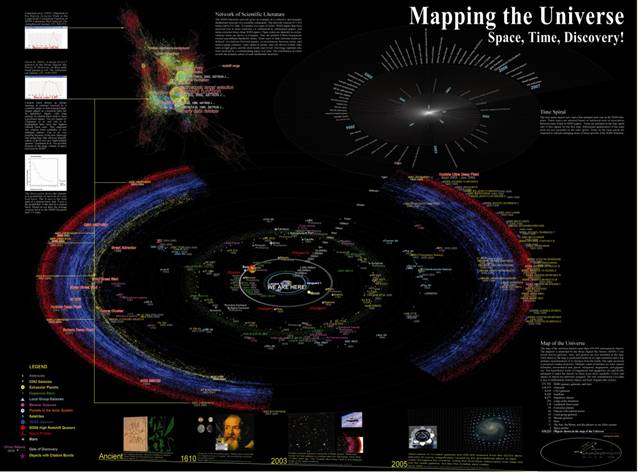
This poster of Mapping the Universe contains three major components: a map of the entire visible universe, a network of scientific literature of the Sloan Digital Sky Survey (SDSS), and a time spiral of emerging topics in the SDSS literature. The full-size poster is downloadable from the following links: Image in TIFF (337 MB approx.)
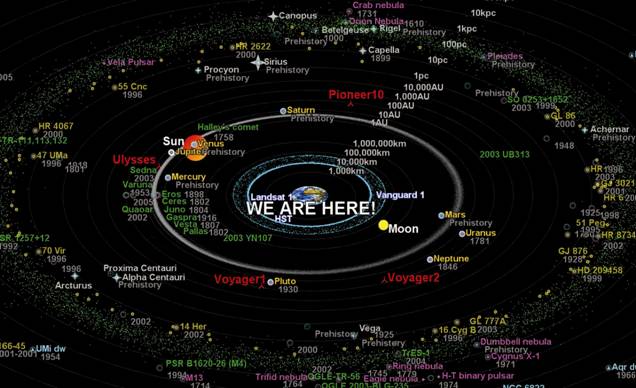
This is the center of the universe map in the Mapping the Universe.
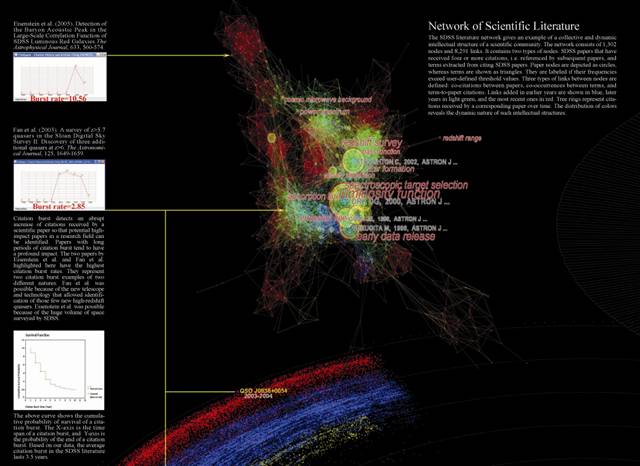
This is the network of scientific literature, a component displayed in the upper left region of the Mapping the Universe. It highlights the two papers with the highest citation burst rates and the nature of the discoveries reported by these papers.
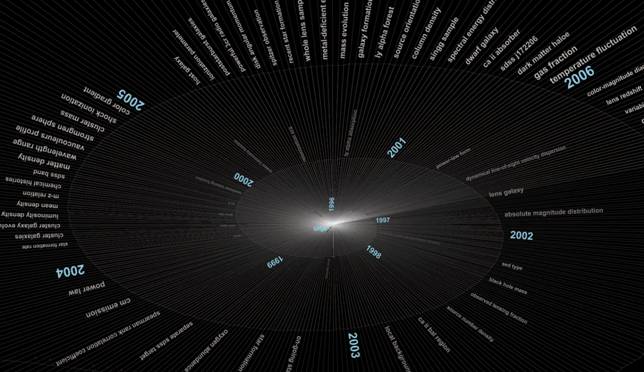
Time spiral shows emerging topics each year in the SDSS literature.
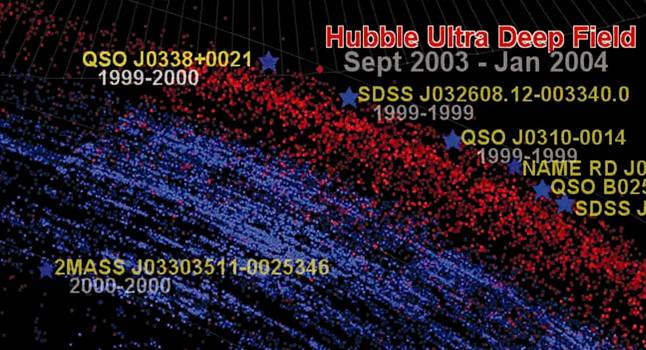
A close-up view of a region containing the famous Hubble Ultra Deep Field (shown as the red diamond).
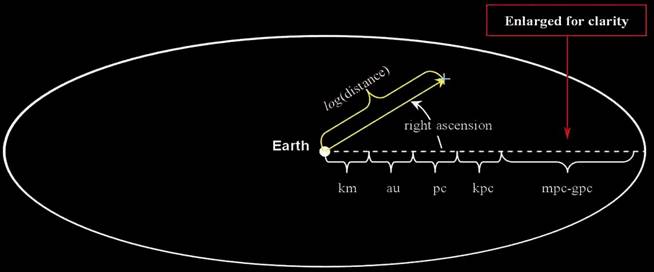
The design of the map of the universe is based on the right ascension and the logarithmic transformation of the distance of an astronomical object to the Earth. The scales between megaparsec (mpc) and gigaparsec (gpc) are enlarged for clarity, especially because these are the focal areas of SDSS.
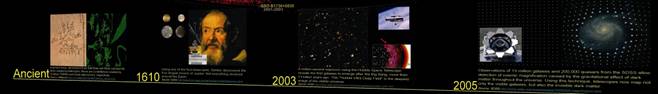
A timeline of major discoveries made possible by increasingly powerful telescopes and a large amount of observational data.
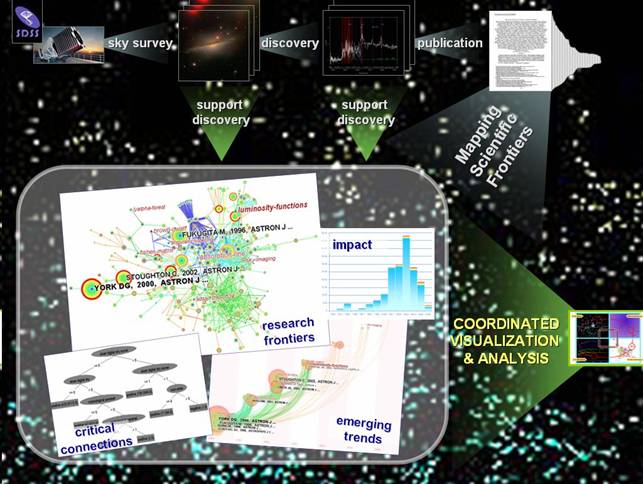
This figure is a schematic diagram of the overall information flow. It focuses on the design of the first stage of the project, in which the primary source of input is the publications resulted from the SDSS research. Research activities focus on four areas in this context, namely identifying research frontiers based on the SDSS literature, identifying the intellectual impact of the SDSS survey data, identifying emerging trends, and identifying critical connections between emerging topics and the impact on the SDSS community. Two major output channels are designed to provide feedback to the SDSS research.
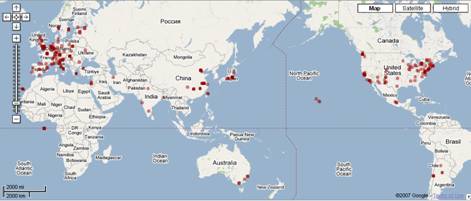
This geographic map shows the distribution of SDSS authors. The density of markers shows the frequency of publications from the marked areas. The SDSS research active areas include the east and west coast of the U.S.A, Europe, Japan, and China. The locations of authors are derived from the bibliographic records in the Web of Science.
This map is generated by CiteSpace, showing a hybrid network of several types of nodes and links. Triangle shapes in the map indicate fast-rising terms in titles and abstracts. The tree-ring like circles denote keywords chosen by authors to index the entire papers. CiteSpace also supports several other types of vertices and links in hybrid networks, including citing authors, cited authors, cited papers, and cited journals. The colors of nodes denote the years when the hosting papers are published. The colors of lines denote when two items are either co-cited or co-occurring.
This map shows the latent semantic space derived from 61 publications of the astronomer co-PI, Professor Michael Vogeley. The six areas are: 1) AGN, 2) void statistics, 3) concepts related to Vogeley’s work with York, 4) and 5) parameters in astronomical research, and 6) void galaxies. The map was generated by Storylines, a system developed in our research group that can identify concept groups in terms of latent dimensions in a latent semantic space. Vogeley was able to identify the connections between these concept groupings and his research based on this map, although Area 2 and Area 6 would be regarded as the same area of research.
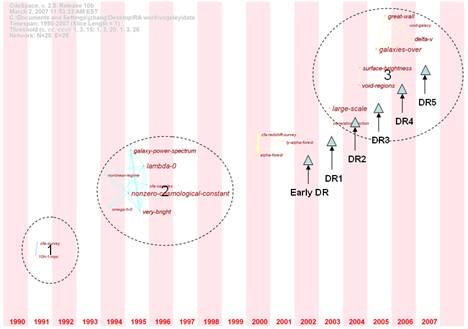
This timeline of bursts of topic terms shows the astronomer Co-PI, Professor Vogeley’s research topics. Terms in 1991 correspond to Vogeley’s undergraduate research topics. Burst terms appearing between 1994 and 1995 correspond to his doctoral studies. Burst terms from 2003 onwards correspond to Vogeley’s research topics related to SDSS. The initial SDSS data release is known as the Early Data Release, followed by 5 annual data releases as shown in the figure. The term large-scale structure was found with a sharply increased popularity in 2003. Topics associated with more recently released SDSS data seem to be more concrete; for example, terms such as void regions and surface brightness represent specific topics.
This is a document co-citation network derived from Vogeley’s 61 papers. The visualization was generated by CiteSpace based on bibliographic records of the 61 papers. The network highlights two distinct areas of Vogeley’s research and, more importantly, how the two areas are connected and how the research focus was transformed from on into the other. The left half of the network consists of cited papers in areas that are not directly related to SDSS research, whereas the right half of the network corresponds to research related to the SDSS survey. The two areas are joined by a series of papers in the middle – they are all SDSS technical papers or data release papers.
This is a variation of a decision tree known as alternate decision trees (ADTs). The classification along a path from the root is based on the positive or negative signs associated with the nodes along the path. Terms in oval shapes are selected based on statistical tests of association so that they are the most predictive terms. Full details are explained in our JCDL 2007 paper.
Citations adjusted by age of publication (Sc) and by age of citation (St).
Location of this page: http://cluster.cis.drexel.edu/~cchen/projects/sdss
Updated: March 1, 2010 |